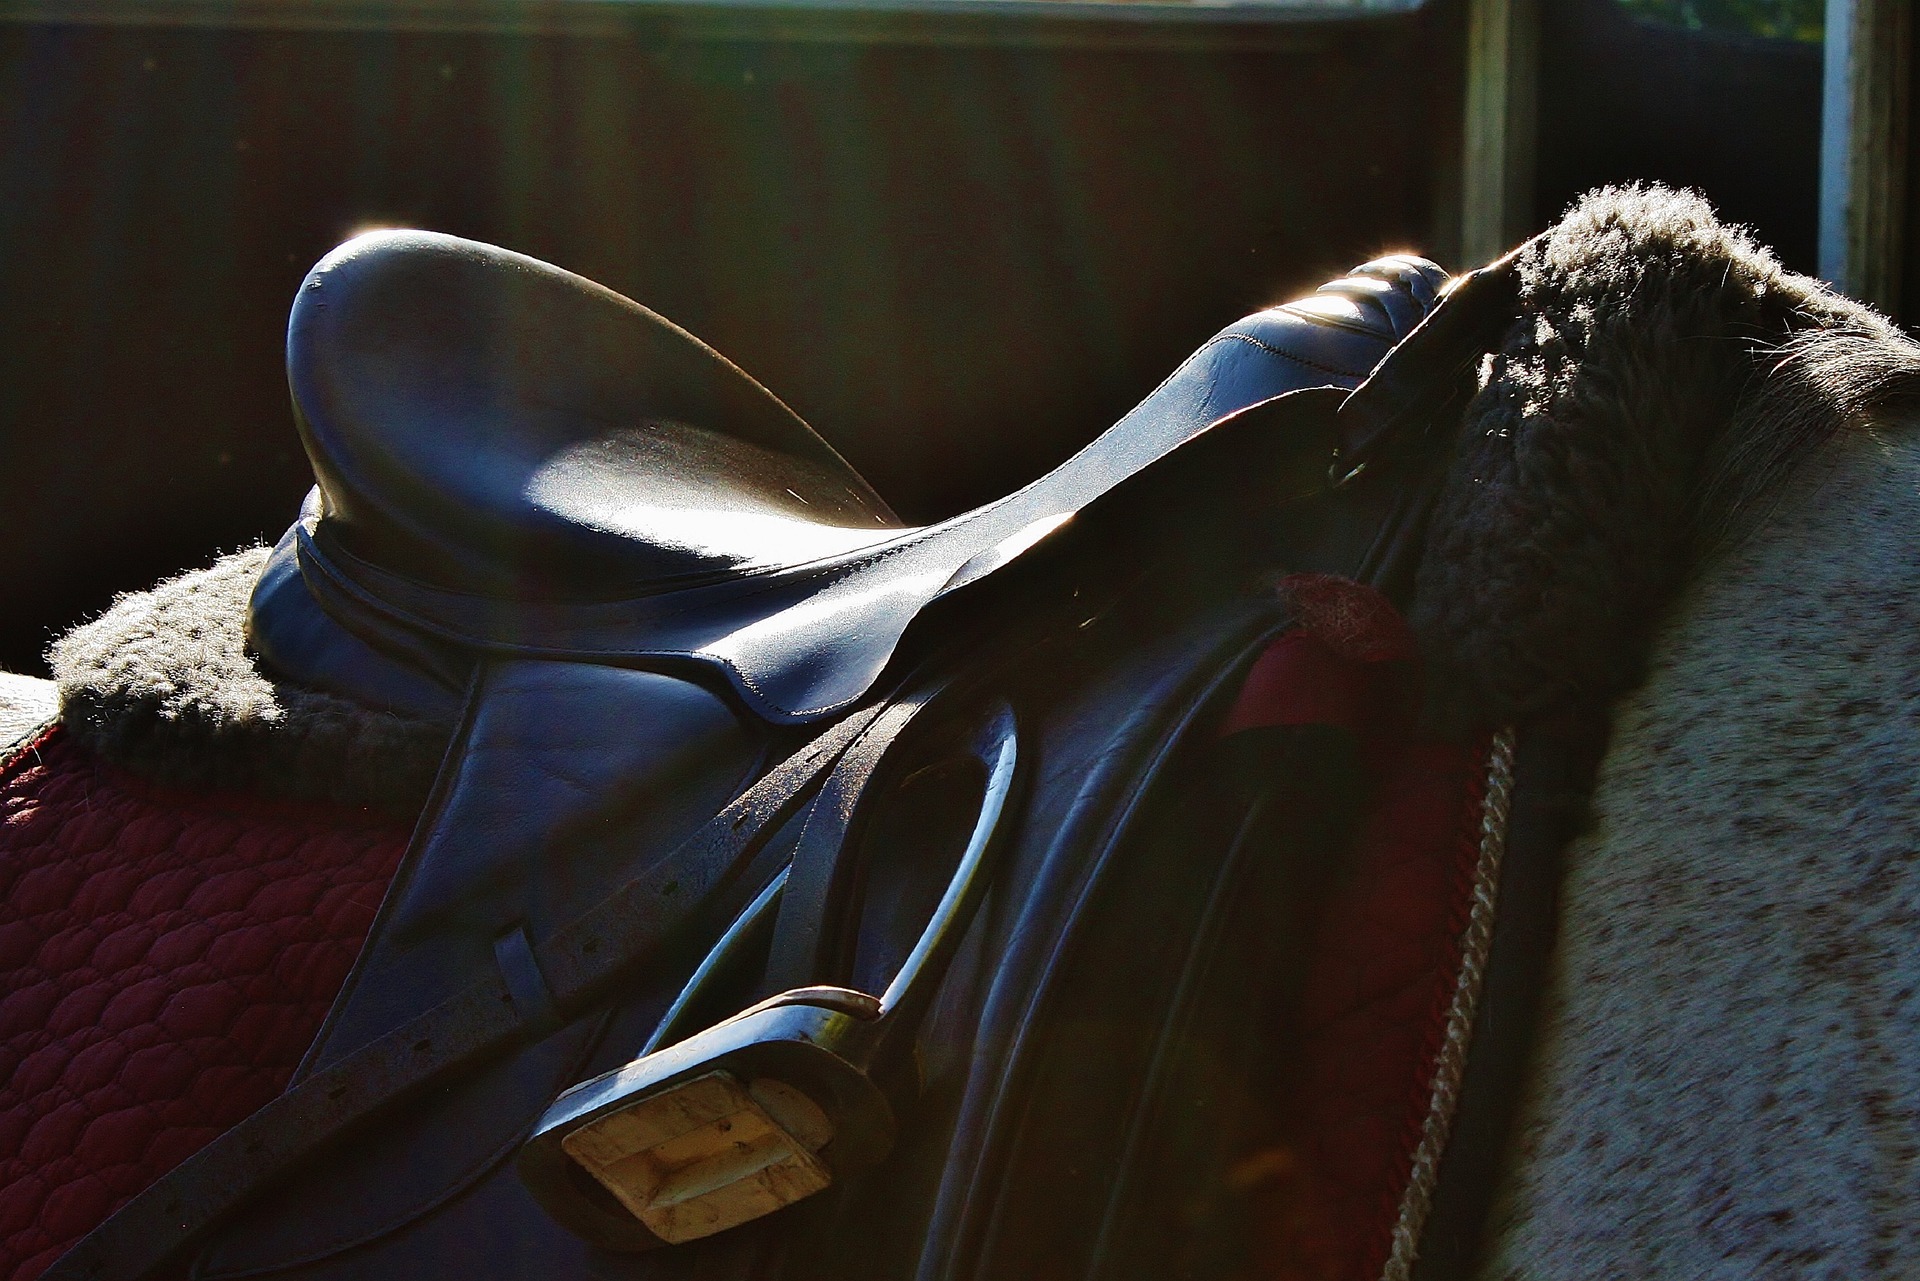
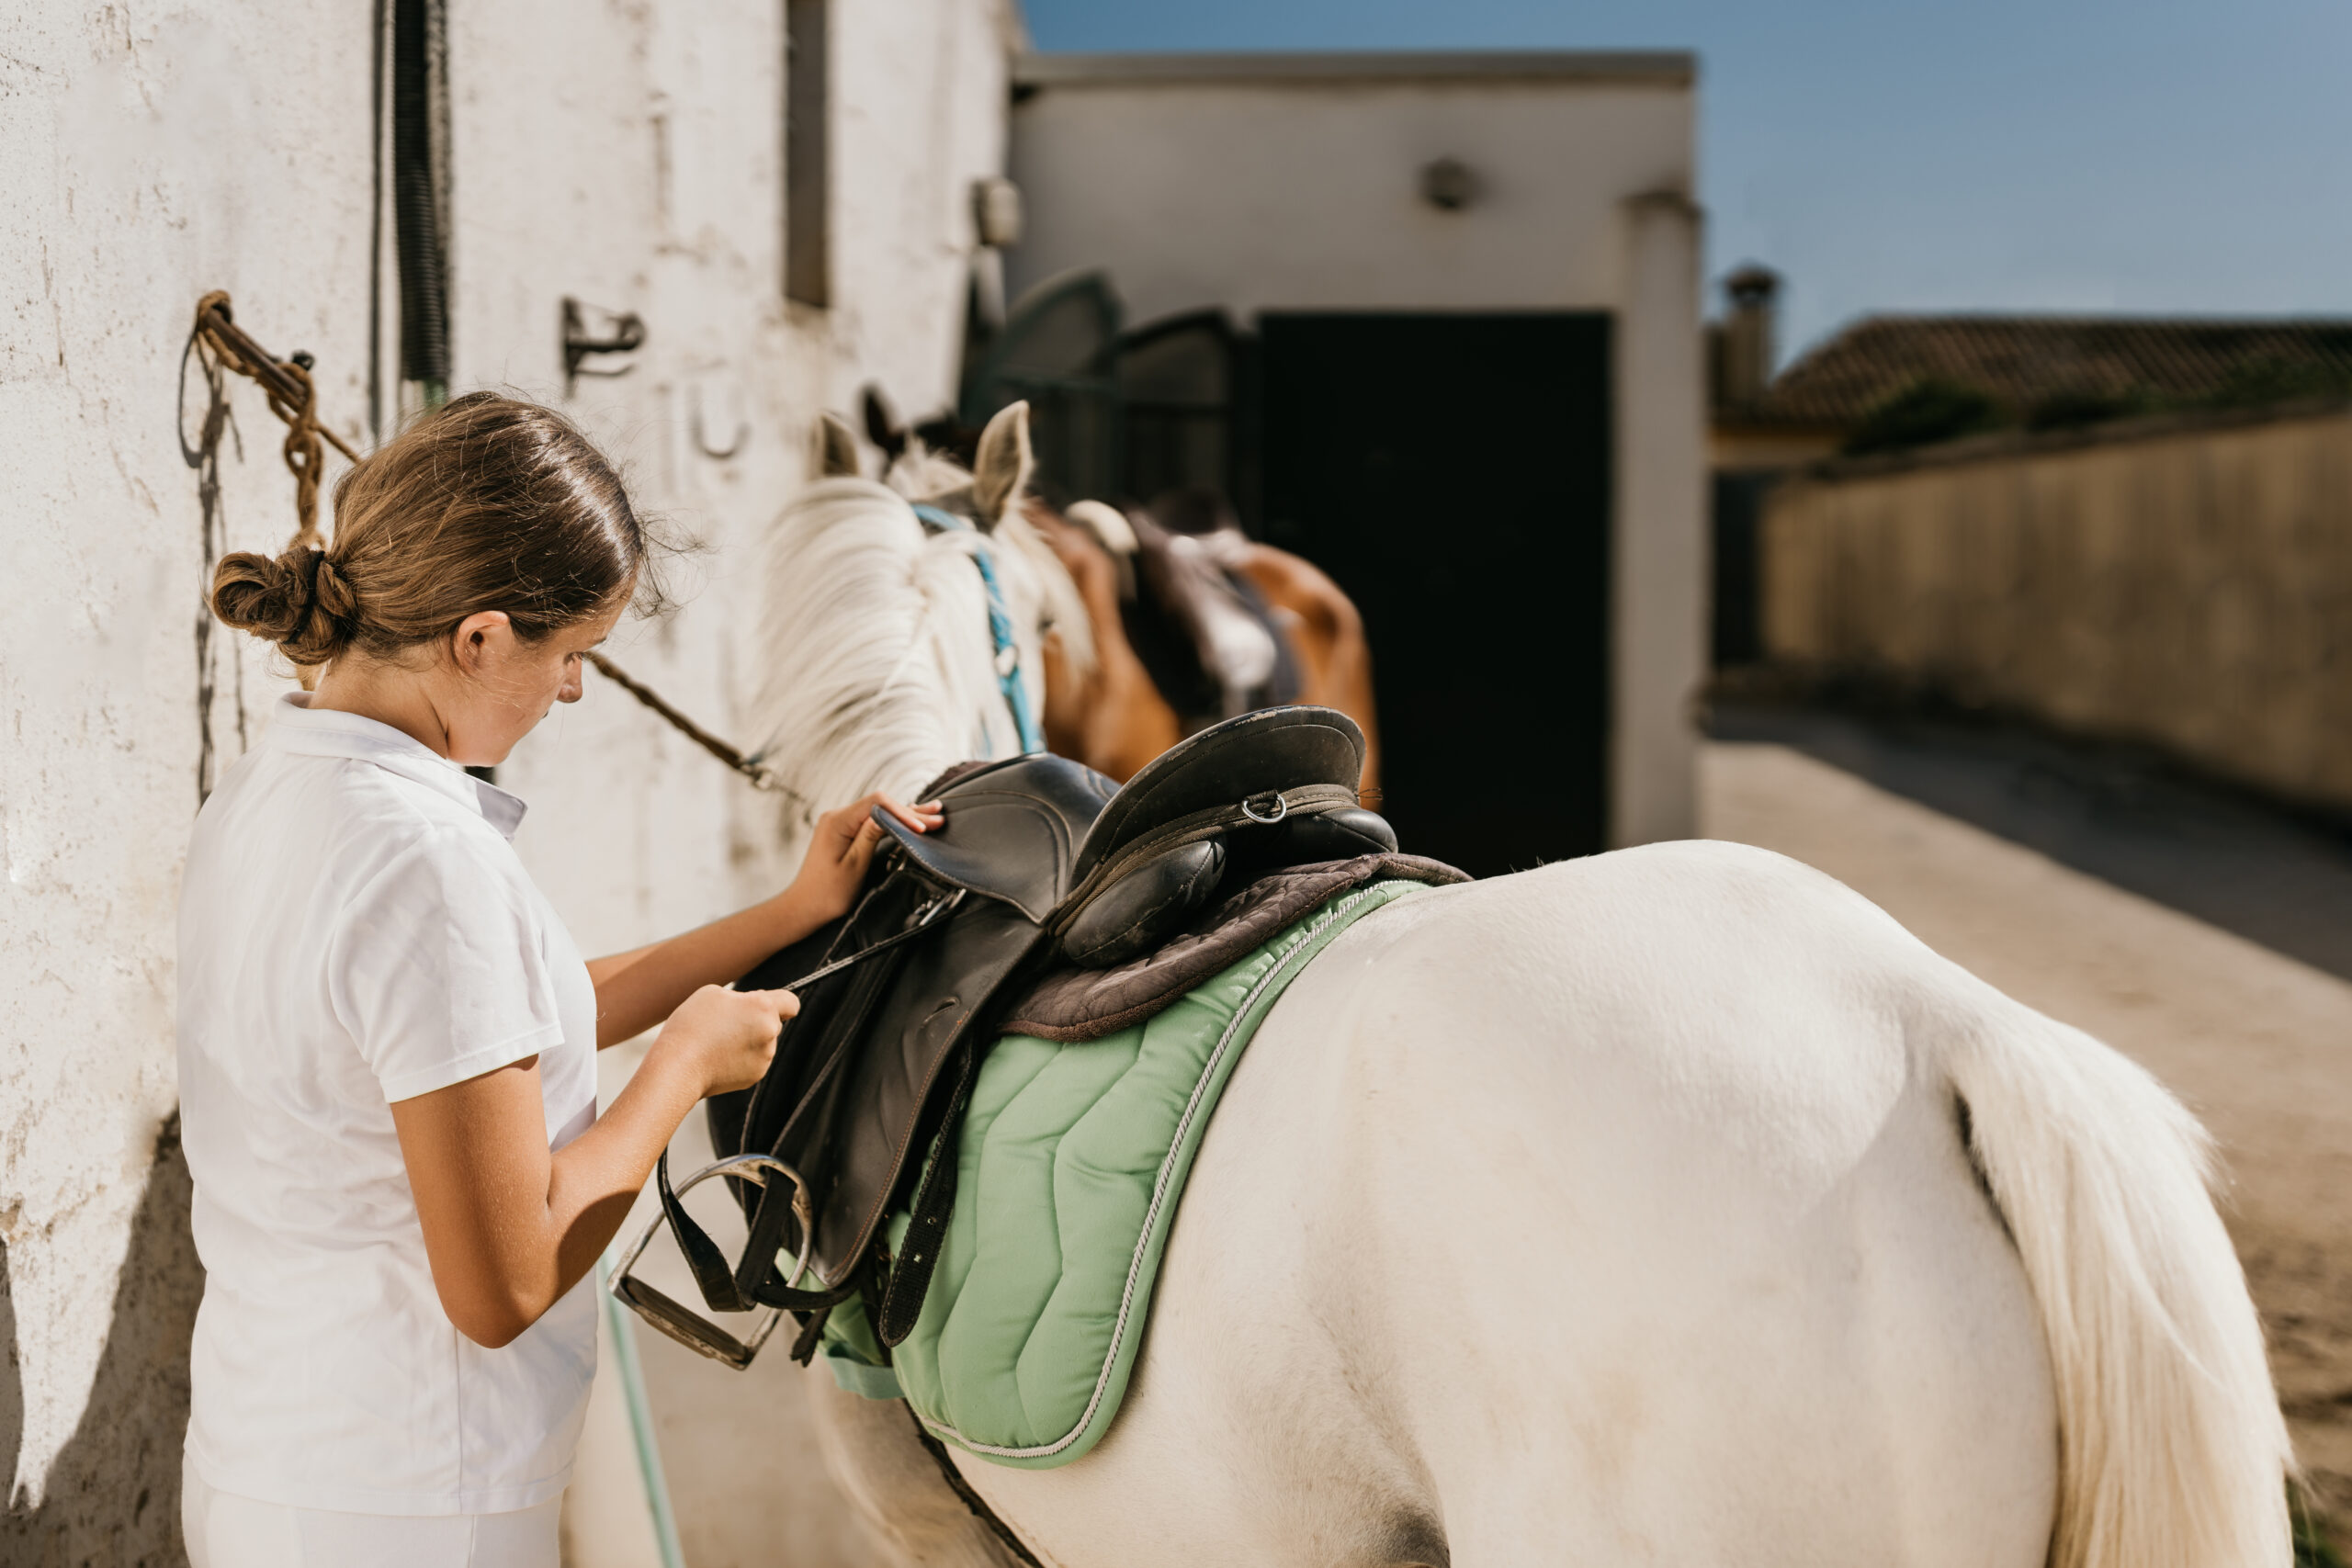
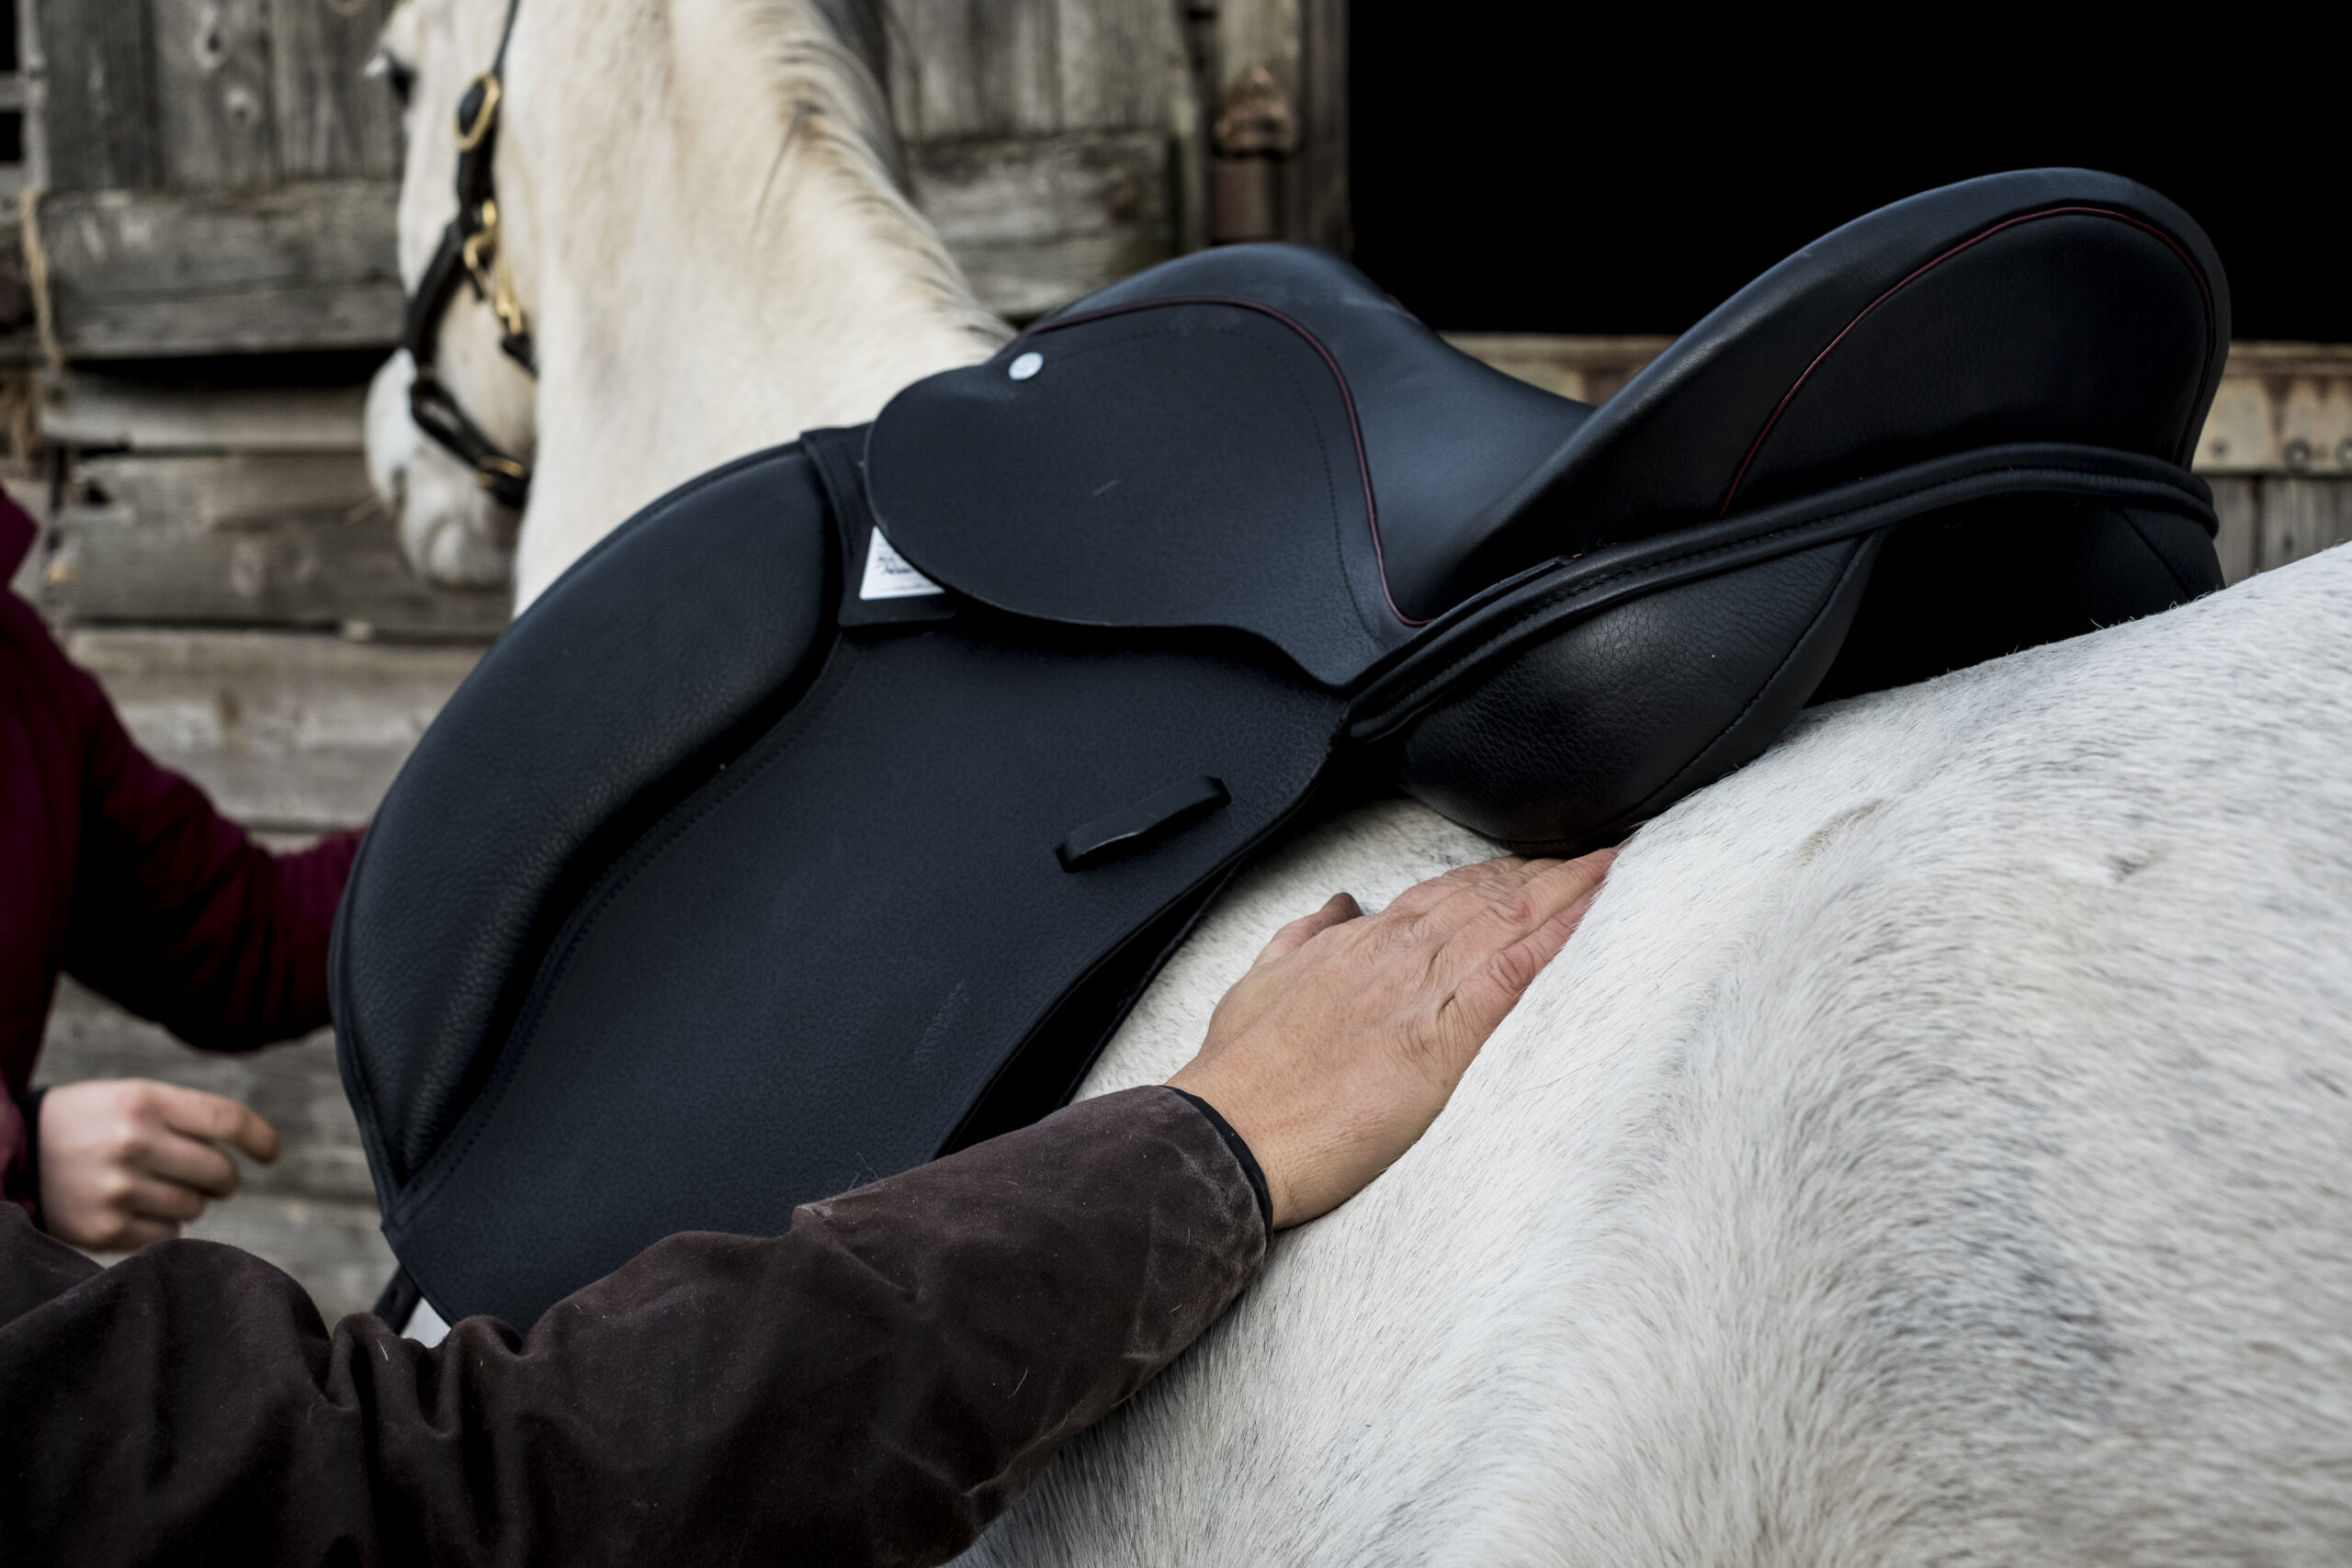
Determining where to put a saddle on a horse seems like it should be simple, but saddle fit and placement can be difficult to get right. Every horse is...
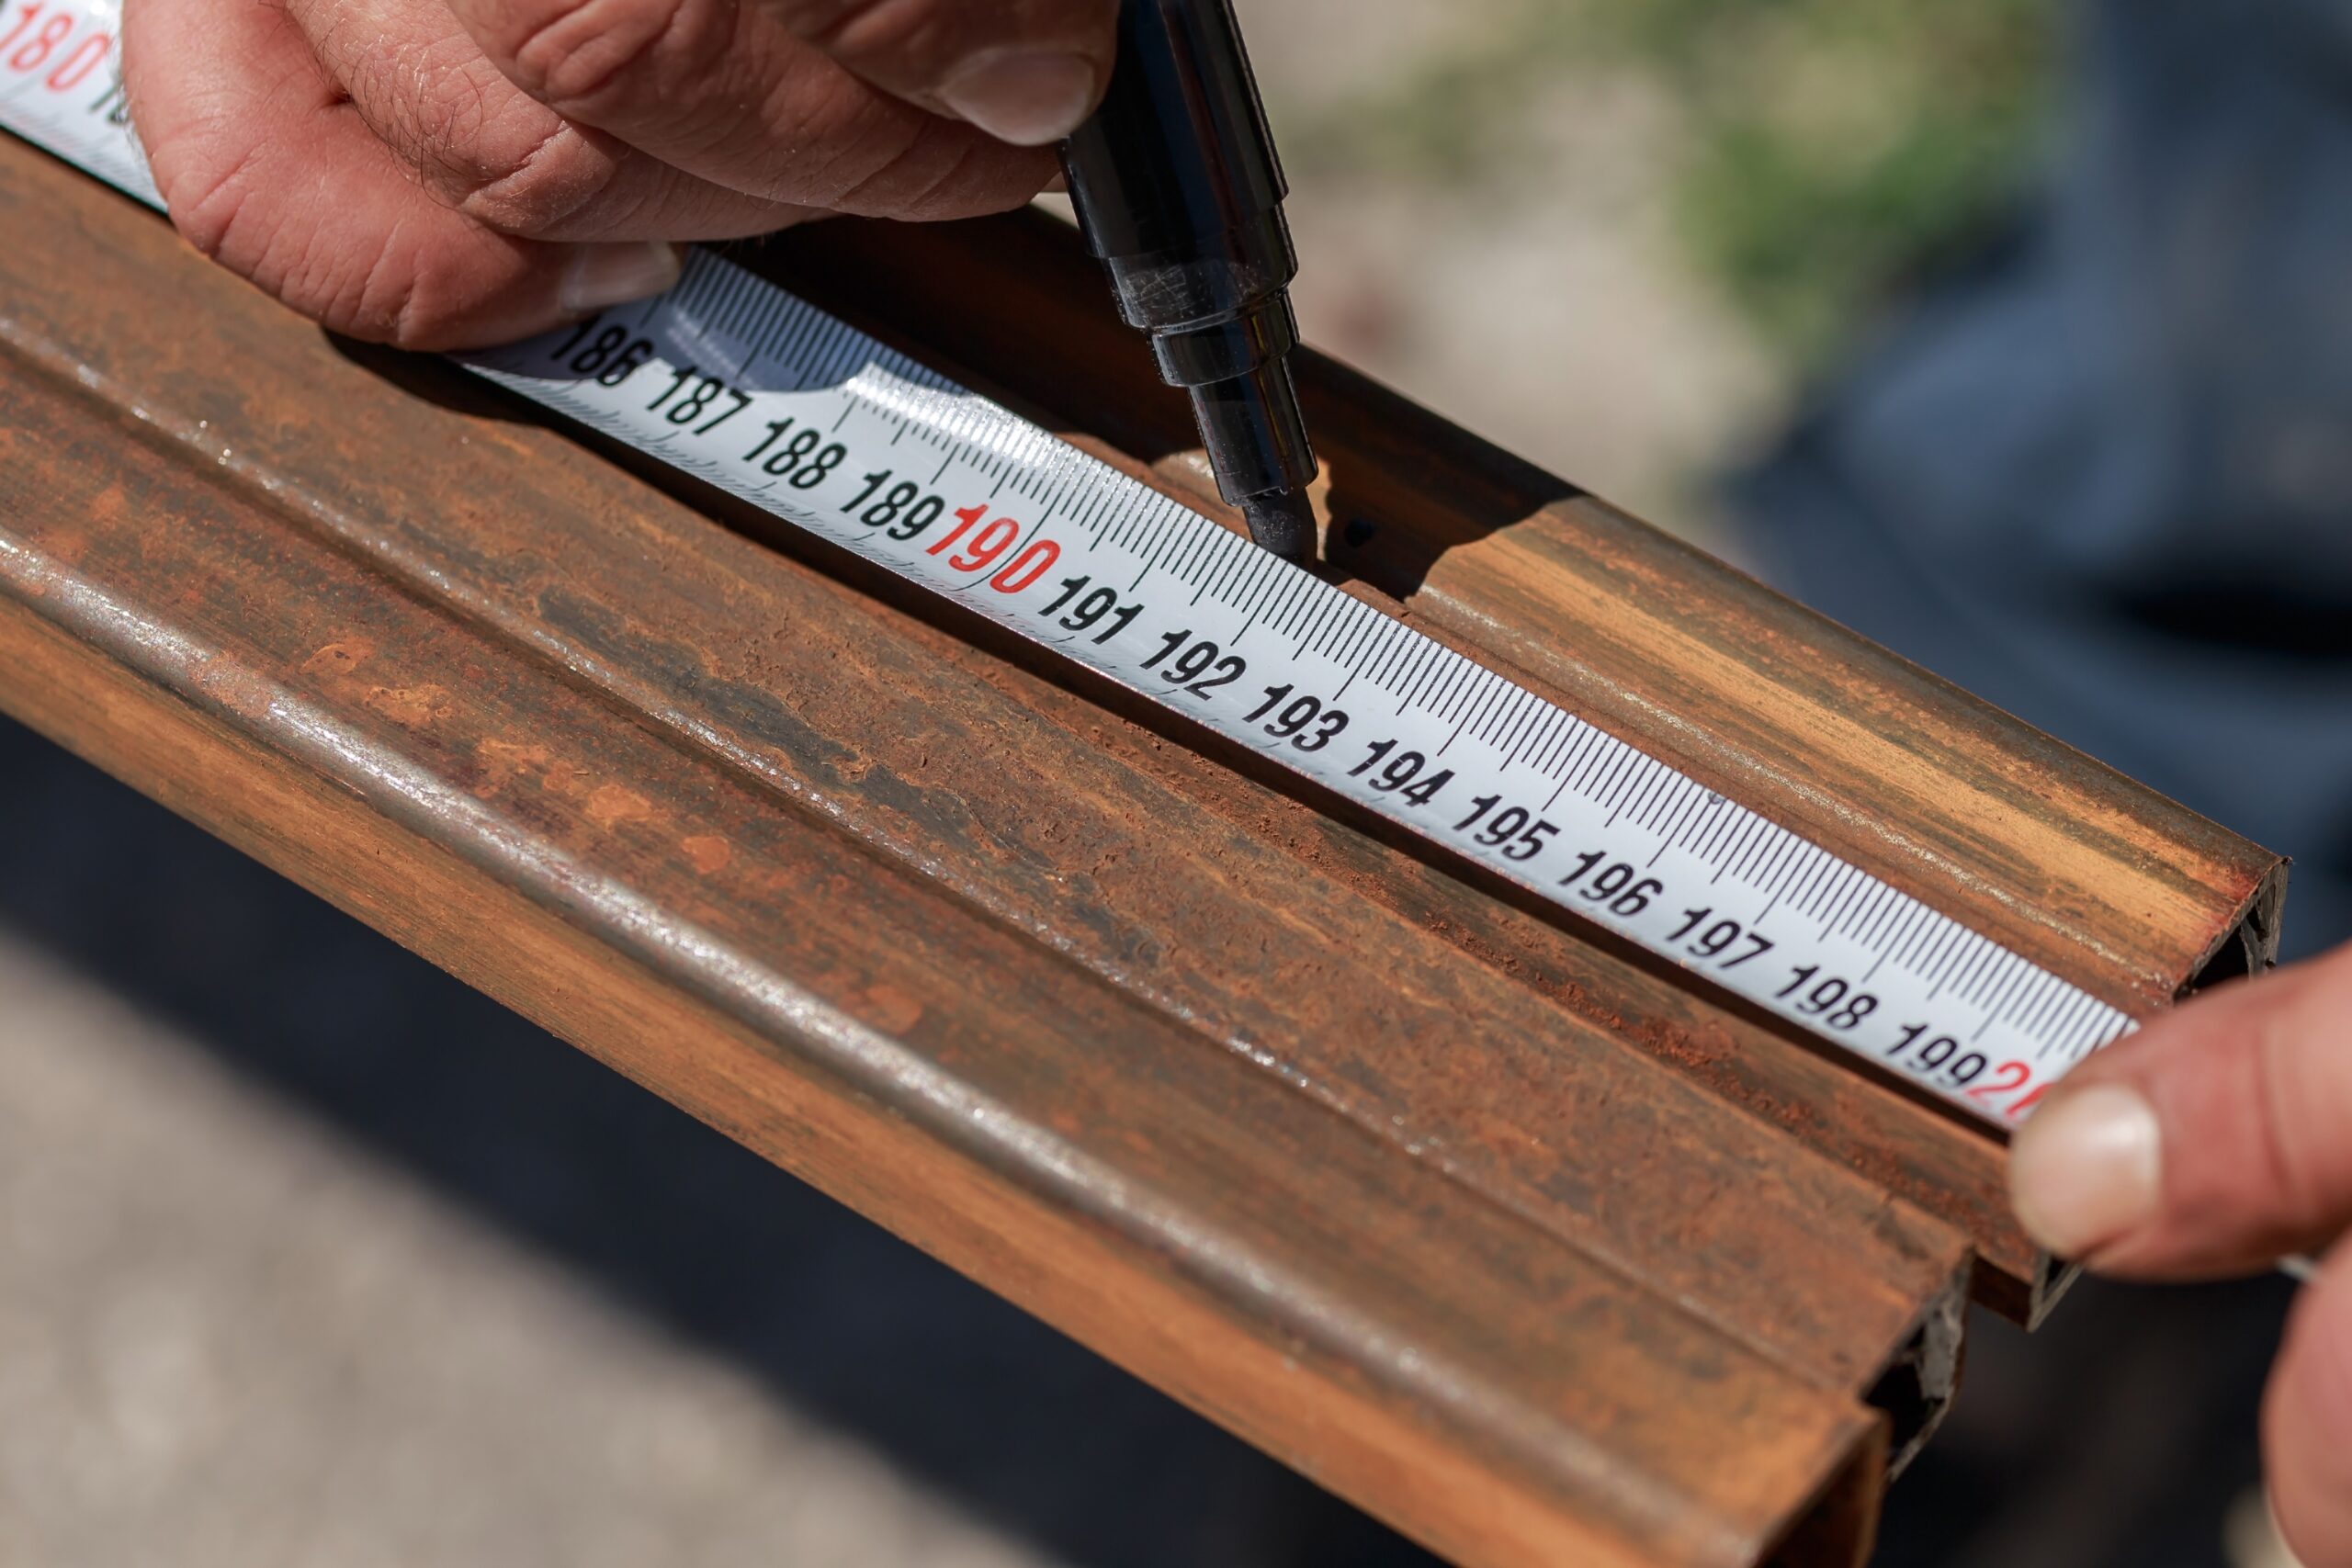
Have you ever wondered how to measure a horses saddle? We're going to cover everything you need to know and you'll definitely want to know about this one tip...